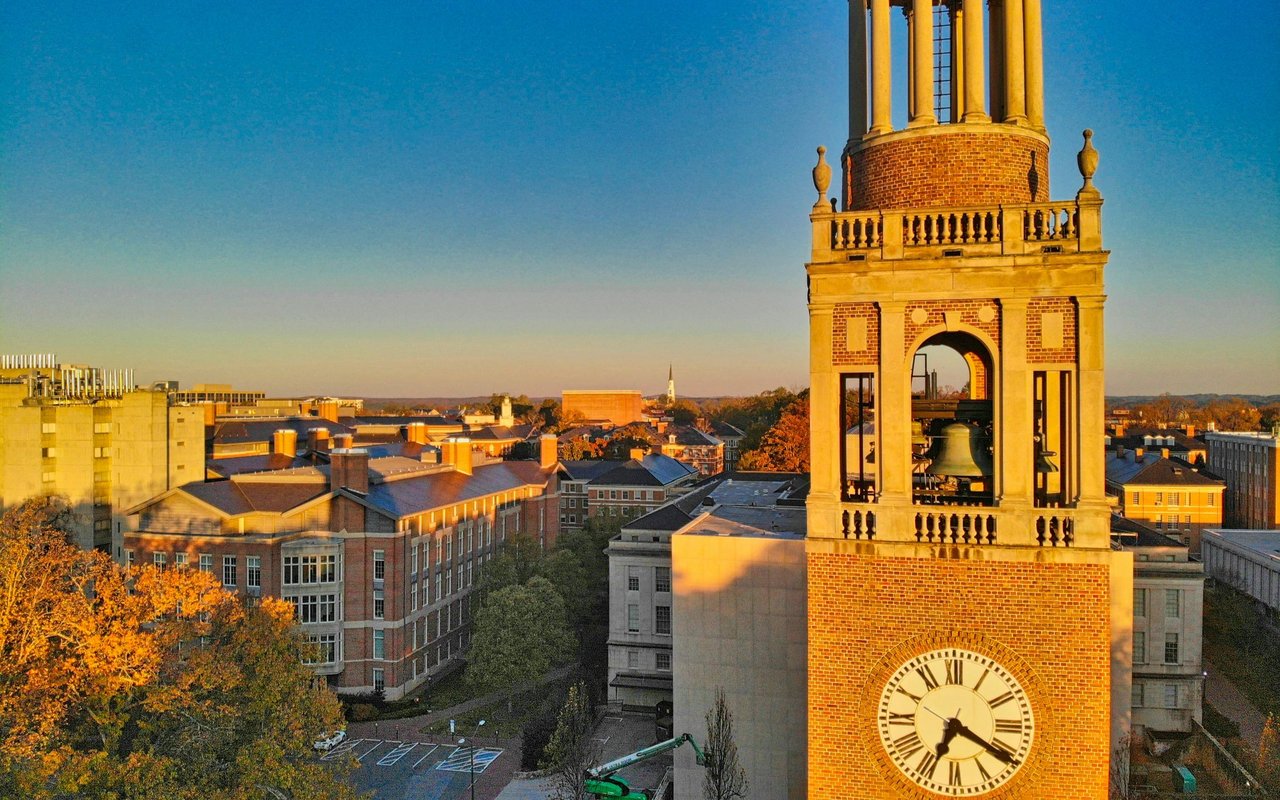
Welcome to
Chapel Hill
Home to UNC — Franklin Street energy, leafy neighborhoods, and Research Triangle access.
Chapel Hill is one of North Carolina's most distinctive towns, home to the University of North Carolina and a vibrant, intellectual community that consistently ranks among the best places to live in the country. Franklin Street's shops, restaurants, and college-town energy sit alongside leafy neighborhoods and a strong commitment to arts, culture, and the outdoors. As part of the Research Triangle, residents enjoy excellent job opportunities, world-class healthcare at UNC, and easy access to Raleigh and Durham. Homes range from historic houses near campus to established neighborhoods and newer communities, all in high demand. Chapel Hill's blend of education, culture, and quality of life keeps values strong and buyers coming. If you want a welcoming, culturally rich community with great walkability and Triangle job access, Chapel Hill is one of North Carolina's most desirable and enduring places to call home.
107,660 people live in Chapel Hill, where the median age is 34.1 and the average individual income is $60,815. Data provided by the U.S. Census Bureau.
Total Population
Median Age
Population Density
Average individual Income
There's plenty to do around Chapel Hill, including shopping, dining, nightlife, parks, and more. Data provided by Walk Score and Yelp.
Explore popular things to do in the area, including Harris Incorporated, El Taco Amigo, and Edie & Daran at Healing Earth Resources.
| Name | Category | Distance | Reviews |
Ratings by
Yelp
|
|---|---|---|---|---|
| Dining | 0.96 miles | 0 reviews | 0/5 stars | |
| Dining | 1.26 miles | 0 reviews | 0/5 stars | |
| Active | 0.75 miles | 2 reviews | 5/5 stars | |
|
|
||||
|
|
||||
|
|
||||
|
|
||||
|
|
||||
|
|
Chapel Hill has 39,605 households, with an average household size of 2.41. Data provided by the U.S. Census Bureau. Here’s what the people living in Chapel Hill do for work — and how long it takes them to get there. Data provided by the U.S. Census Bureau. 107,660 people call Chapel Hill home. The population density is 883 and the largest age group is Data provided by the U.S. Census Bureau.
Total Population
Population Density Population Density This is the number of people per square mile in a neighborhood.
Median Age
Men vs Women
Population by Age Group
0-9 Years
10-17 Years
18-24 Years
25-64 Years
65-74 Years
75+ Years
Education Level
Total Households
Average Household Size
Average individual Income
Households with Children
With Children:
Without Children:
Blue vs White Collar Workers
Blue Collar:
White Collar:

2901 Coltsgate Rd Charlotte, NC 28211
2901 Coltsgate Rd Charlotte, NC 28211
